Author: James Keegan, Chief Investment Officer, Chairman, Seix Investment Advisors LLC
Contrary to recent commentary in the financial press, we believe that gold and U.S. Treasuries can both perform well at the same time as gold is rallying due to negative real rates, among other things.
Does the decline in real rates and rise in gold prices signal higher inflation on the horizon as some pundits have suggested?
Hardly. The decline in real rates has been driven by the deflationary pressures that have driven nominal rates down by about 140 basis points (bps) this year, not inflation. In fact, the Core PCE Price Index— the Federal Reserve’s (Fed) preferred inflation gauge because it excludes food and energy prices from personal consumption expenditures prices—is down to 0.95% y-o-y through June after ending 2019 at 1.62% y-o-y.
Treasury Real Yield Curve Rates, 2020
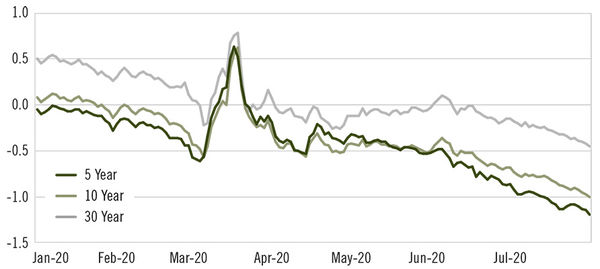
Source: U.S. Treasury, Data as of 7/31/20
Past performance is not indicative of future results.
Treasury Real Yield Curve Rates. These rates are commonly referred to as "Real Constant Maturity Treasury" rates, or R-CMTs. Real yields on Treasury Inflation Protected Securities (TIPS) at "constant maturity" are interpolated by the U.S. Treasury from Treasury's daily real yield curve. These real market yields are calculated from composites of secondary market quotations obtained by the Federal Reserve Bank of New York. The real yield values are read from the real yield curve at fixed maturities, currently 5, 7, 10, 20, and 30 years. This method provides a real yield for a 10-year maturity, for example, even if no outstanding security has exactly 10 years remaining to maturity.
Gold as a Deflationary Hedge?
The knock on gold has always been that it has no yield, but it is now out yielding bonds when viewed through the lens of negative real rates. The COVID-19 pandemic is a deflationary shock that exacerbates the existing structural deflationary forces of excessive debt/ unfunded liabilities; aging demographics; excess global capacity/ “zombie” companies (definitions vary, but most agree that a zombie company does not earn enough to cover its interest payments); and low productivity growth.
“Zombie” Companies Continue to Multiply
Share of U.S. companies with debt servicing costs that are higher than profits, 1990-2020
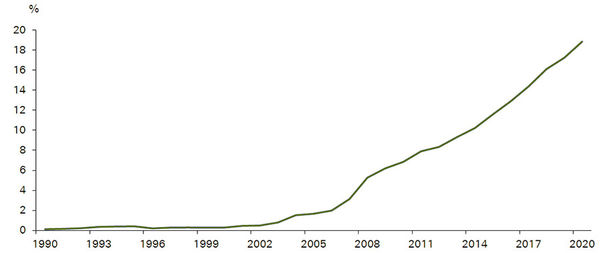
Source: DataStream, Worldscope, Deutsche Bank Global Research, July 20, 2020.
Past performance is not indicative of future results.
As a result, long nominal U.S. rates will continue to converge to the lower yields offered in Europe/Japan. We are seeing money supply growth numbers that we have never seen before, but the velocity of money continues to plumb new lows due to the lack of aggregate demand that has increased the output gap.
While Money Supply Growth Reaches New Highs…
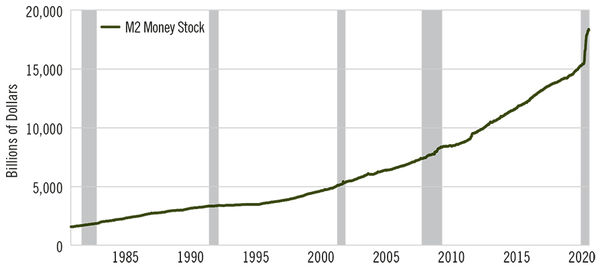
Source: Federal Reserve Bank of St. Louis
Past performance is not indicative of future results.
…The Velocity of Money Hits New Lows, Signaling Continued Demand Shock
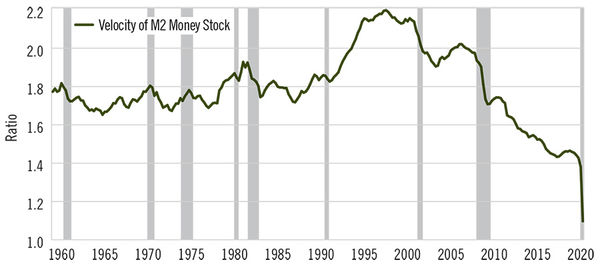
Source: Federal Reserve Bank of St. Louis
Past performance is not indicative of future results.
The key will be to continue to monitor aggregate demand/ velocity of money, as we do not have confidence that the current Fed will be quick to remove the excess liquidity should velocity start to rise. However, it will be Q4 of 2022, using the Bloomberg consensus GDP forecast, before the United States is back to year-end 2019 GDP levels.
Our Outlook for Investment Grade Bonds
As full-cycle, total-return bond managers, we typically overweight the spread sectors when returns per unit of risks are attractive, and underweight and preserve capital when returns per unit of risk are unattractive.
For instance, coming into 2020, we were very underweight risk in general. We had about a half of benchmark weight to the corporate sector. We were very overweight Treasuries, where prices rallied, driving the yield about 100 bps lower. This enabled us to take advantage of the dislocation that occurred in the March, April, and May timeframe.
Since then, we have gone from being very underweight to modestly overweight corporate credit risk. This shift was easy to execute given our Treasury overweight, hence we reduced our exposure to Treasuries to fund the higher allocation to corporates. In addition, as the yield curve began to steepen over the second half of Q2, we tactically initiated a yield curve flattening strategy across our full market mandates.
Consequently, in the longer portfolios that are benchmarked against the Bloomberg Barclays Aggregate Bond Index, we are overweighting the 30-year part of the curve and underweighting the five-year part of the curve. In the intermediate portfolios, the same sort of flattening trade has resulted in overweighting the 10-year part of the curve and underweighting the two-year portion. We believe that the Fed, for all intents and purposes, has effectively put a yield curve control (YCC) strategy out to the two-year Treasury. You could even argue that the implicit YCC strategy extends beyond the two-year horizon, as the Fed has been fairly aggressive in its verbal forward guidance. Also, the Fed’s most recent quarterly “dot chart” (June FOMC meeting) included a median expectation for an unchanged target rate through 2022.
By the end of July 2020, the corporate market had rallied significantly, even as the investment grade sector leveraged up to 3.9x from 2.9x (pre-COVID) and cash flow headed lower, according to our pro forma analysis. Nominal spreads may now appear about average, but on a leverage-adjusted basis, spreads have returned to all time tights.
Suffice it to say, security selection is going to be absolutely key going forward. We remain overweight the corporate sector and a few sectors that we’re favorably-disposed toward, which we have been for a while, are the gold miners and energy complex. The excessive volatility in the oil market over the March and April time period offered a unique opportunity to take advantage of and we were able to add to our energy exposure and capitalize on the repricing that took place over the May to July time frame.
U.S. fixed income still has the potential for capital appreciation, particularly at the longer end of the yield curve, thereby offering the same hedge/diversification that investors have come to expect from their investment grade bond allocation.